From source data to a production plan and its review.
I designed and implemented interfaces for a system connecting the production model, plan creation and adjustment, materials, supplies and review screens.
- Product
- Production planning system
- Industry
- Pipe manufacturing
- My role
- UX/UI Designer · Low-code Developer
- Team
- Cross-functional project team
- Project status
- Implemented version shown in recorded demo
Planning required orders, production and material availability to work as one process.
To make a decision on an order, employees needed to consider product specifications, deadlines, the production queue, production capabilities and materials. Individual data points only became useful when connected in one workflow.
Make the planning chain understandable and connected.
The user needed to move from source data and constraints to a production model, then create or adjust a plan and finally review the result through the available comparison and statistics screens.
I structured the interface around three connected stages.
1. Model the production environment
User task: define and review the data describing the production environment. Here, the digital twin was a production model of the enterprise, used to account for equipment, production capabilities, constraints and other parameters available to the system. I designed the screen structure and forms so this information could become the basis for planning.
2. Build and adjust the production plan
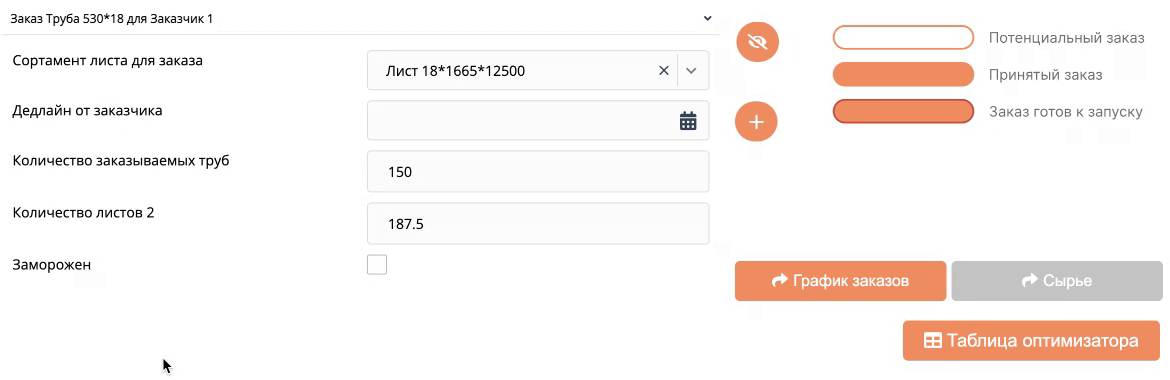
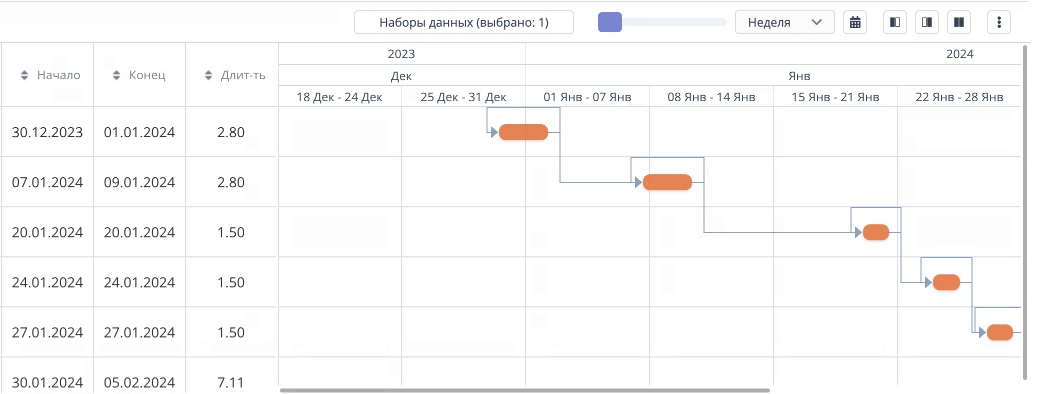
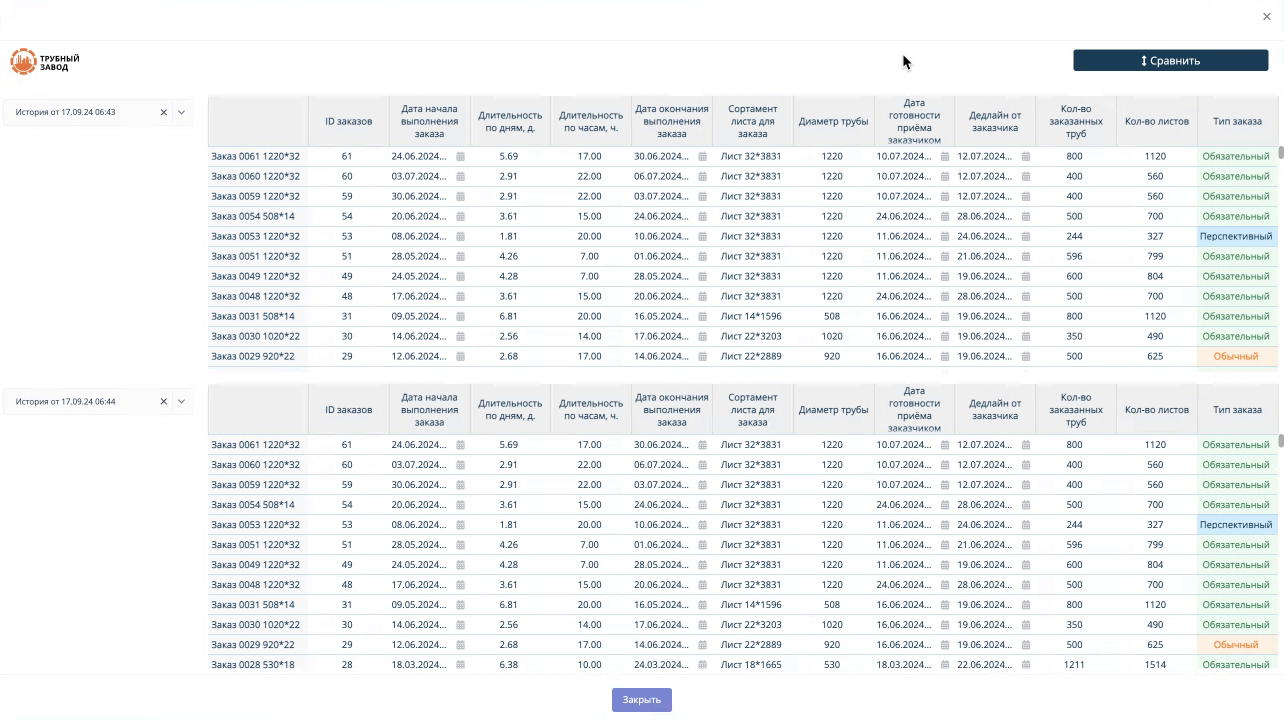
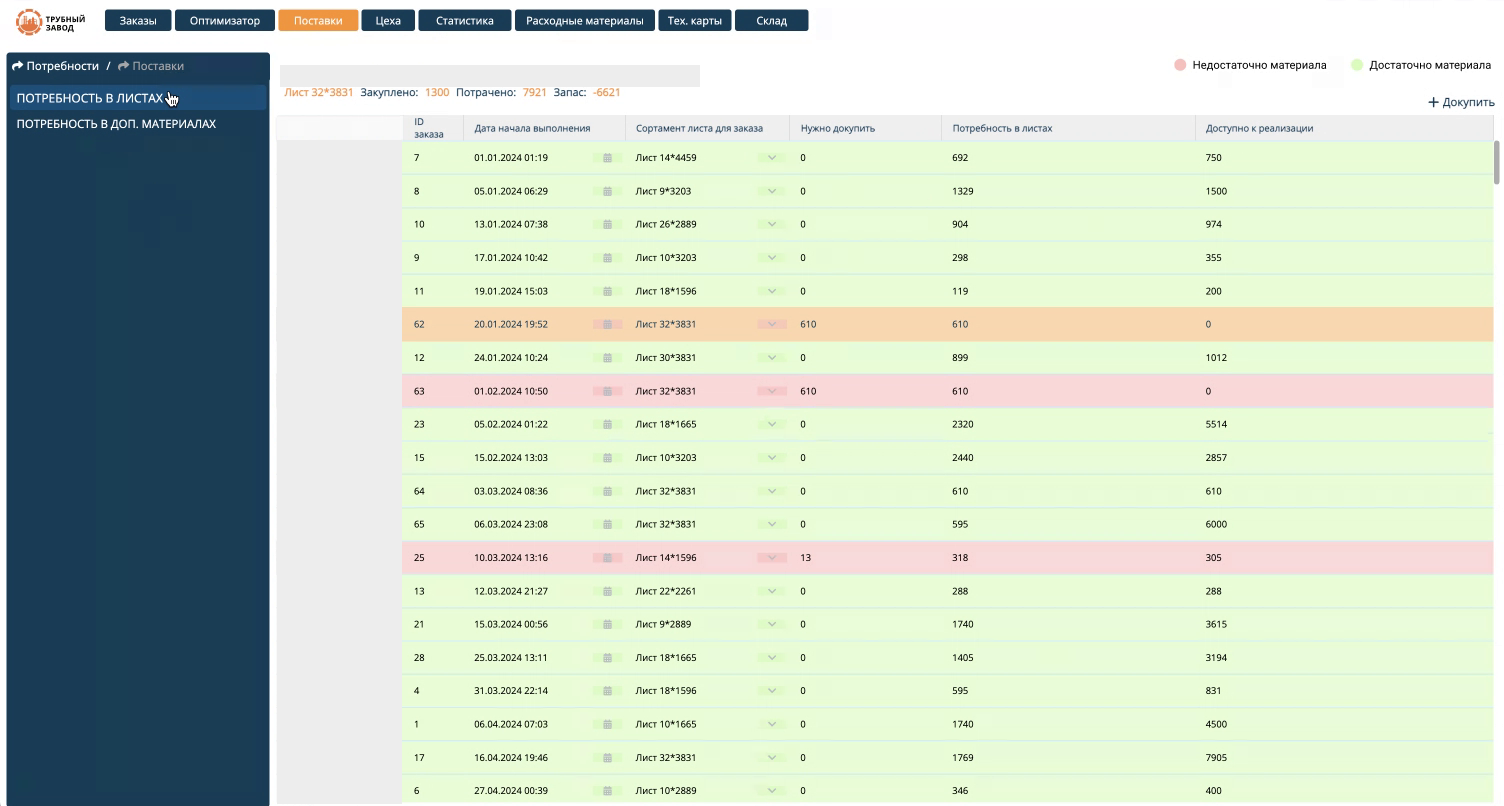
User task: create or adjust a plan option using data and constraints from the production model. The interface covered orders, a schedule view, saved variants, plan comparison and material checks. I designed the flows and prototypes and implemented the interfaces. I do not claim the optimizer was fully automatic or AI-based.
3. Review statistics and plan performance
User task: review the resulting plan and related information before further action. The source materials include comparison tables, time-based views and material data screens. Where the exact meaning of a metric cannot be confirmed, I keep the description neutral rather than assigning an unsupported business interpretation.

A connected user flow was implemented from the production model to plan review.
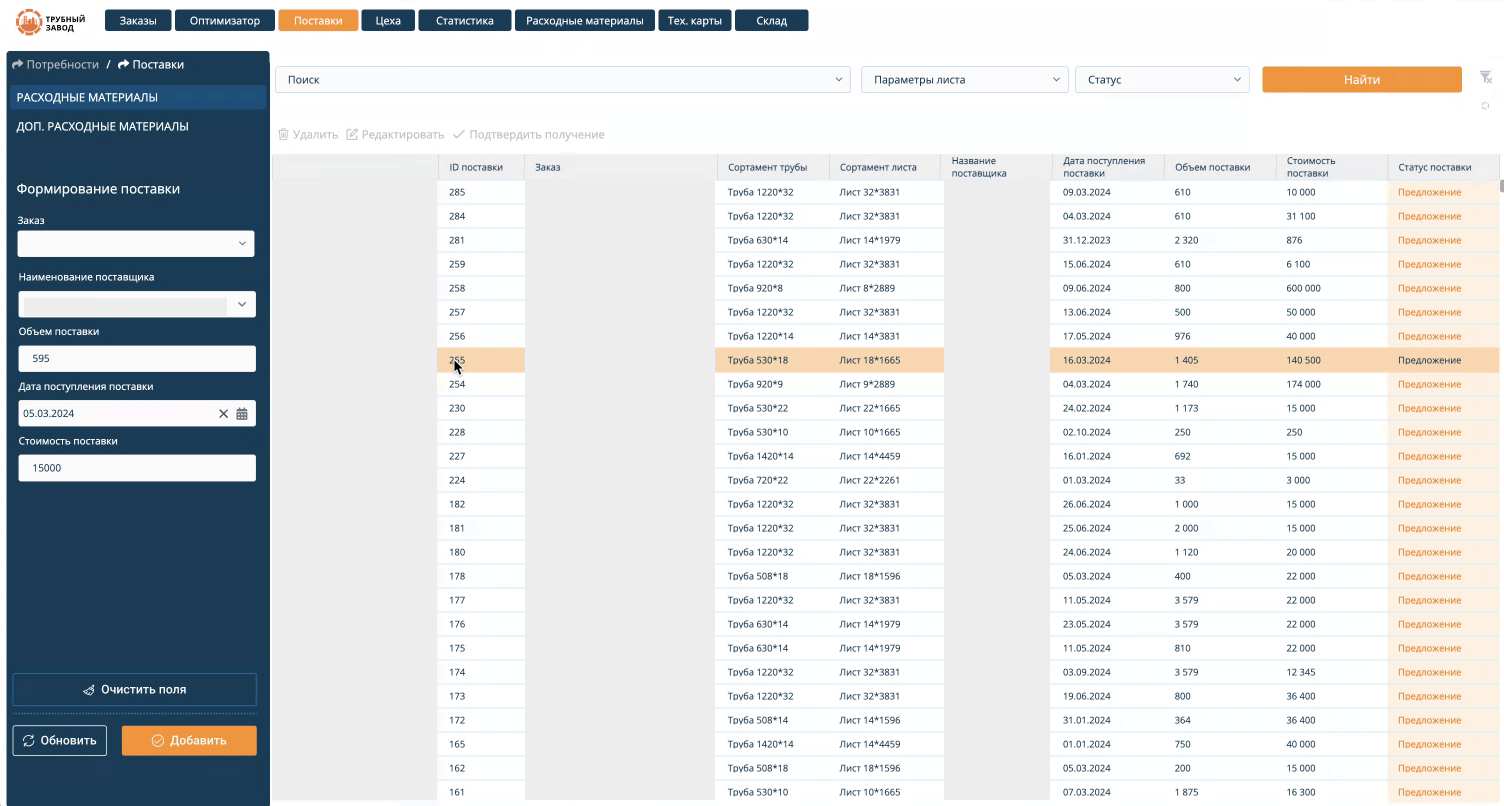
The recorded demo confirms working interfaces for plan comparison, materials and supplies, while earlier screens show the production model, schedule and analytical views.
Screens come from saved project versions and demonstration materials. On-screen values are not presented as project outcome metrics.